Ever since I started developing mobile apps through Android Studio, I was amazed with its debugging capabilities out of the box. It was a lot faster to narrow down on the area of the codebase that was causing bugs through a debugger, allowing you to step through the code line by line and see how the variables change with each step. I wanted a tool that is similar to that experience when I started coding web applications in Laravel and thankfully, a tool like that does exist in the form of XDebug. This simple guide will hopefully help you set it up in your local environment and get you started. Let's jump right in!
XDebug is a free and open source extension for PHP, originally developed by Derick Rethans, that provides very good debugging features. It allows you to step through the code, allowing you to see all initialized variables and how they change line by line. On top of that, it comes with other features such as code profiling that help find performance bottlenecks in your code, log function calls, and even help analyze code coverage for your unit tests. These won't be part of the scope of this article but will be a subject of later posts.
There will be no need to constantly type in dd() and dump() to do the same thing (at least not as often as usual). This will make debugging and development of new features easier to do.
Setting it up
1. Install XDebug If you use Wampserver, XDebug comes packaged with PHP by default. But if you use Laragon or XAMPP, you might need to install the plugin yourself.
2. Head to the directory where your PHP folder is installed. If you have multiple versions of PHP like what wampserver does, choose the version you are using for your project.
3. Find phpForApache.ini for Wampserver users or php.ini for those who use other local server software and copy paste the following after the last line. Replace zend_extension with the DLL file of the XDebug version you have downloaded if it isn't packaged with the local server software you use. Do remember to change xdebug.log and xdebug.output_dir to the file location you prefer. You can also configure xdebug.client_port and xdebug.remote_port to any valid port number that you want. For this example, it's just set to 9001.
; XDEBUG Extension
[xdebug]
zend_extension="php_xdebug-3.4.0beta1-8.2-vs16-x86_64.dll" ;change this to the xdebug DLL file you have
;xdebug.mode allowed are : off develop coverage debug gcstats profile trace
xdebug.mode=debug
xdebug.output_dir ="C:/laragon/tmp"
xdebug.show_local_vars=0
xdebug.log="C:/laragon/logs/xdebug.log"
xdebug.log_level=7
xdebug.start_with_request=yes
xdebug.client_port=9001
xdebug.remote_port=9001
xdebug.idekey=VSCODE
xdebug.client_host="127.0.0.1"
4. In VSCode, install the PHP Debug extension
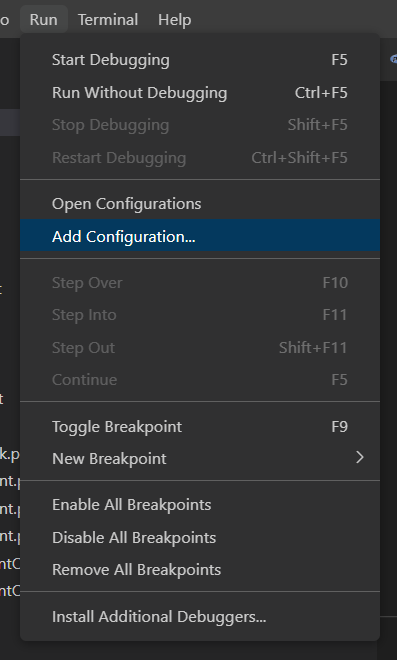
5. Once the extension is installed, go to Run in the menu bar located at the upper left corner and click "Add Configuration"
6. Copy paste this in the launch.json file that will appear in your editor. If you have existing configurations, simply copy paste the items in the configurations section at the end of your own configurations section. Alternatively, if "Listen for XDebug" is already present in launch.json, you can just change the port value to what you set in xdebug.client_port and xdebug.remote_port.
{
    "version": "0.2.0",
    "configurations": [
        {
            "name": "Listen for Xdebug",
            "type": "php",
            "request": "launch",
            "port": 9001
        },
    ]
}
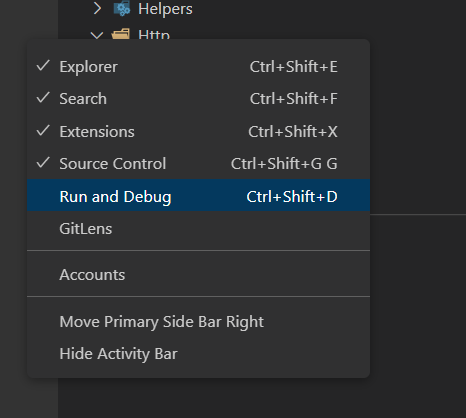
7. Right click in the left side where the toolbar is and make sure "Run and Debug" is visible.
How do I use it?
1. In the upper left, click the Run menu and select Start Debugging (alternatively, you can press the F5 key) or in the left sidebar, select Run and Debug (or press Ctrl + Shift + D).
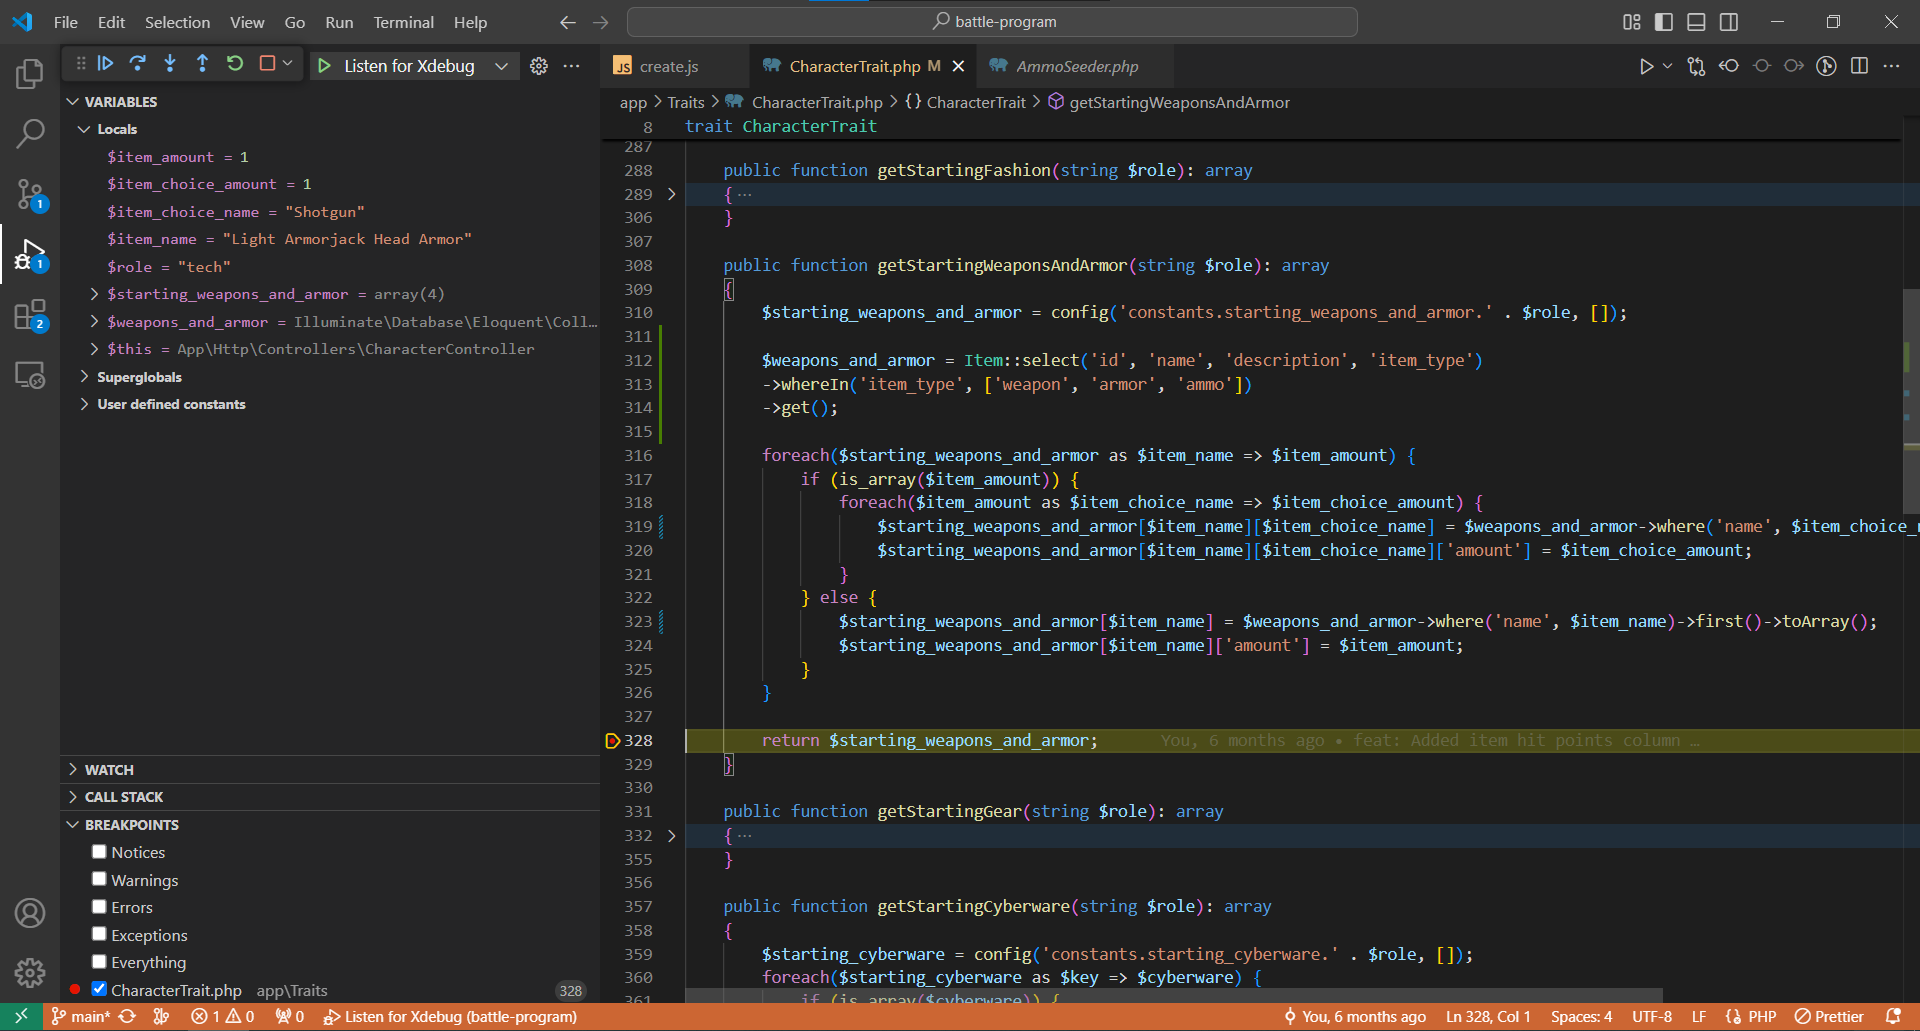
2. Select "Listen for Xdebug" in the dropdown menu and click the green play button.
3. Set a breakpoint by hovering behind the line number and clicking the dark red hint marker. If all goes well, you should see the web application freeze when that piece of code you set a breakpoint to is reached and you can see each variable and its values and be able to step through the code line by line to determine its behavior through VSCode.
Guide to the Debugger's Controls
Here are the controls you'll be using in order to use the debugger.
This is the Continue button. This allows the web application to proceed again until the next breakpoint.
This is the Step Over button. This goes to the next line of code.
This is the Step In button. This does the same thing as Step Over but it goes in depth with each line of code and will get into the library-level if you are using a function from it such as Carbon.
Step Out button allows you go backwards through each line of your code from the breakpoint you set.
Restarts the debugger.
Stops the debugger.


